
Introduction & Objectives
Harbor seals (Phoca vitulina) and gray seal (Halichoerus grypus atlantica) are year-round coastal inhabitants in eastern Canada and New England, and occur seasonally in the mid-Atlantic United States (U.S.) between September and May (Hayes et al. 2022).
Individuals of both species move to northern areas for mating and pupping in the spring and summer, and return to southerly areas in the fall and winter. In previous years, there was some debate about the southern range extent for both of these stocks in the Western North Atlantic.
Until 2018, NOAA Stock Assessment Reports (SARs) indicated that the gray and harbor seal populations range from New Jersey to Labrador; with scattered sightings and strandings reported as far south as North Carolina for gray seals and Florida for harbor seals (Hayes et al. 2018). Other researchers have reported that harbor and gray seal distribution along the U.S. Atlantic coast appears to be expanding or shifting (den Heyer et al. 2021, DiGiovianni et al. 2011, Johnston et al. 2015, DiGiovianni et al. 2018). In Virginia, reports from local anglers, Chesapeake Bay Bridge Tunnel (CBBT) staff, and the Virginia Aquarium & Marine Science Center have indicated that seals have been using the CBBT rock armor or "islands" to haul out on for more than a decade. Additionally, annual pinniped stranding numbers have generally increased in Virginia since the early 1990s, with 2020 being a lower than average stranding year (Costidis et al. 2021). The apparent range expansion of harbor seals may be due to the rapid growth of gray seal populations in Canada and the Northeastern U.S. (den Heyer et al. 2021, Wood et al. 2022), which could be causing the displacement of harbor seals at haul-out sites (Cammen et al. 2018; Pace et al. 2019; Wood et al. 2019).
Within the last decade, harbor seals have been observed returning seasonally, from fall to spring, to haul-out locations in coastal Virginia, and gray seals are also occasionally observed during the winter, but not on a consistent basis (Ampela et al. 2023; Jones and Rees 2022). NOAA SARs now indicate the southern extent for the harbor seal population range is North Carolina. However, the geographic range for the gray seal population remains the same (Hayes et al. 2022).
This study aims to document seal presence at select haul-out locations in the lower Chesapeake Bay and coastal waters of Virginia, which are important areas to Navy training and testing activities. Haul-out counts and photo-identification (photo-ID) methods are being utilized in order to acquire a better understanding of the seals’ seasonal occurrence, habitat use, and haul-out patterns in this area. This study continues to provide valuable baseline information for the future assessment of seal movement, site fidelity and abundance in the mid-Atlantic region.
Technical Approach
A series of systematic, vessel-based counts of all seal species will be conducted at two different survey areas; 1) in the lower Chesapeake Bay along the CBBT, on the four “islands” (referred to as CBBT 1, CBBT 2, CBBT 3, and CBBT 4), and 2) on the southern tip of the Eastern Shore, which is comprised of about five main haul-out locations. Haul-out surveys will start in the fall (November) and end in the spring (April/May) to ensure documentation of seal arrival and departure for the season. During each survey, the number of seals hauled out and in the water will be recorded with associated environmental data (e.g. air and water temperature). The use of unmanned aircraft systems (e.g. drones) at the Eastern Shore survey area was added in 2018 to help improve count accuracy during vessel-based point counts and assess the distribution of pinnipeds in the region. Photographs of seals will be collected between counts for photo-ID for a mark-recapture study to estimate the local population abundance and to develop a local catalog. A second approach for estimating abundance will also be attempted using seal count data from the CBBT and Eastern Shore survey areas as well as satellite telemetry data on harbor seal activity in Virginia waters (Ampela et al. 2023).
Progress & Results
For the 2024/2025 field season at the CBBT survey area, 11 survey days were completed between 4 November 2024 and 22 April 2025. Overall, 76 seals in total (combined in-water and hauled-out) were sighted across the four CBBT haul-out locations, with more seals observed at CBBT 4 (n = 56) and CBBT 3 (n = 19). All the seals sighted this season were harbor seals. Seals were observed on 7 of the 11 (63.6 percent) survey days. The total daily number of seals counted per survey day ranged from 0 to 24 seals, with the highest count recorded in January. For the Eastern Shore survey area, 12 survey days were completed between 5 November 2024 and 24 April 2025. Seals were observed on 10 of the 12 (83.3 percent) survey days, with a total of 132 seal sightings recorded for the season. All the seals sighted this season were harbor seals. The total daily number of seals counted ranged from 0 to 36 individuals per survey day, with the highest count recorded in January. Seals were observed hauled out at only two of the five main haul-out sites that are on the western side of the inlet.
The UAS (i.e., drone) was used to conduct five counts during the 2024/2025 season, specifically from November 2024 to February 2025. The UAS was unable to be used during several surveys throughout the season due to high winds and limited availability of UAS operator. A higher seal count was recorded from the UAS (compared to observers on the vessel) during one of the five survey days, with the count differential only being 1 animal. The observers recorded more seals from the vessel-based counts compared to the UAS counts during four of the five survey days, with the count differential ranging from 1-10 animals. There was no significant difference between the mean counts for the UAS compared to the observer (tstat = -0.31, p = 0.77).
Since the start of the study in 2014, a fluctuation in seal presence has been observed for the CBBT survey area, with an increasing trend in the average number of seals observed per survey day and maximum count from 2014 to 2018, followed by a decrease from 2018 to 2020. For the 2020/2021 season, seal presence appeared to rebound, with an increase in average seal count as well as maximum seal count for a single survey day. Seal numbers continued to fluctuate from 2021-2025 with average and maximum count ranging from 10-13 seals and 24-38 seals, respectively. A similar fluctuation in seal presence was observed for the Eastern Shore survey area, over nine field seasons. Average and maximum seal count increased from 2016 to 2018 but decreased to 15 seals for the 2018/2019 season. Both average and maximum seal count started to increase again after 2019 with some fluctuation over the 2020-2025 seasons. Since the first season for each survey area, some of the lowest total, maximum, and average seal counts for the CBBT and Eastern Shore were reported for the 2018-2020 seasons as well as the 2024/2025 season. Additionally, a statistically significant difference (Fstat = 2.04, p = 0.035) was observed between the average seal counts across the 11 field seasons (2014-2025) for the CBBT survey area. The difference between the mean counts across the nine field seasons for the Eastern Shore survey area was not statistically different (Fstat = 0.43, p = 0.90). This between-season comparison, however, does not take into account the sampling bias for some of the field seasons.
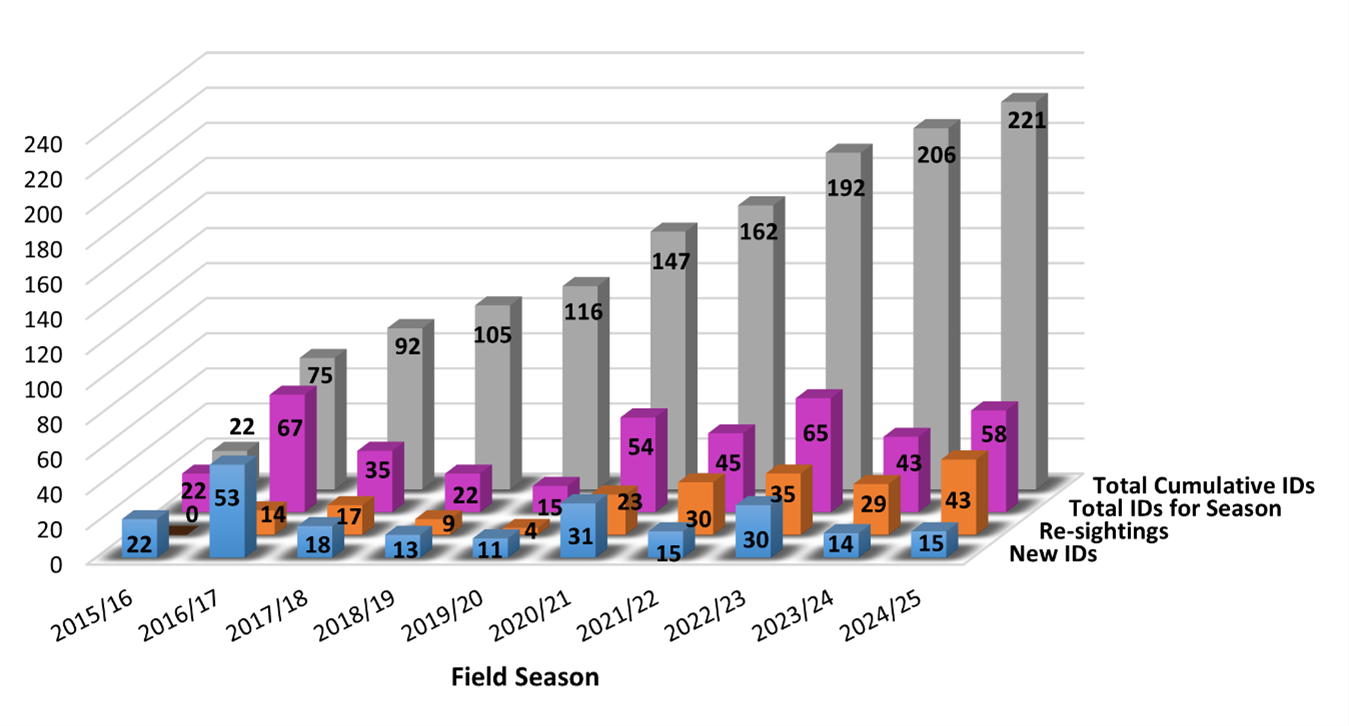
Harbor seal identifications over nine field seasons (2015-2025). The purple bars indicate the total number of identifiers (IDs) for a season, orange bars indicate the number of re-sightings, i.e., those IDs that were seen in previous seasons, and blue bars indicate the number of new IDs added to the catalog. The gray bars indicate the total number of cumulative unique IDs.
With the data collected under this project as well as the haul-out behavior data from the harbor seal tagging project (see Ampela et al. 2023), the first seasonal abundances for harbor seals in Virginia were estimated using various methods. Mark-recapture data from the photo-ID was used to fit a Chapman modification of the Lincoln-Petersen model. A correction factor was applied to the count data, which was based on telemetry data on harbor seal haul-out activity in Virginia waters. Abundance estimates calculated from the Lincoln-Peterson model and telemetry correction factor approach ranged from 35 (95% CI: 4.56-65.44) to 131 (95% CI: 78.79-182.85) and 62 (95% CI: 34.54-89.23) to 126 (95% CI: 94-158.4) individuals, respectively. General trends for both approaches show an initial decrease in abundance from 2016-2019, followed by an increase and then a fluctuation in estimates between 2021-2025. Regression analysis results indicate no statistically significant trend in abundance estimates across seasons, therefore, the local population may be stable. Using the telemetry correction approach, a mean abundance of 82 individuals was estimated for the 2016-2025 seasons.
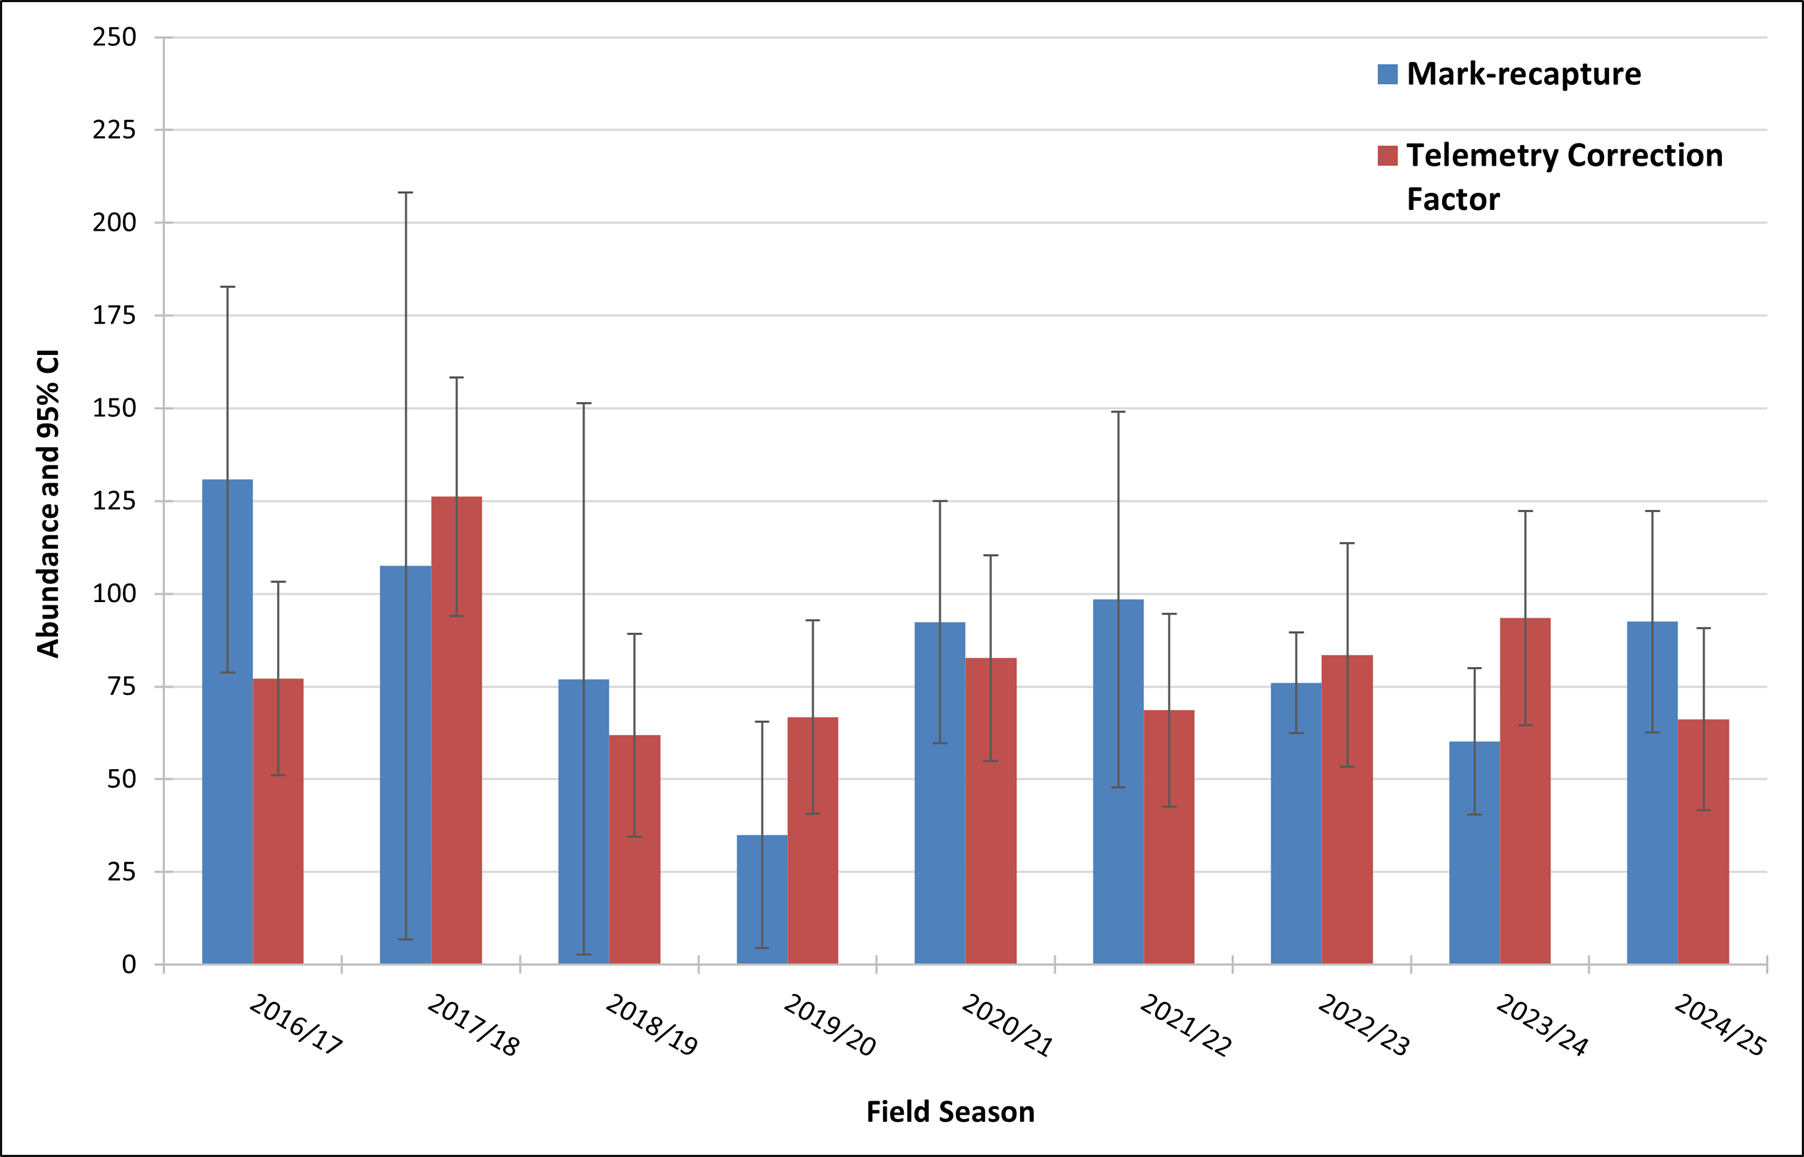
Total abundance estimates and 95% confidence intervals (CIs) for the CBBT and Eastern Shore survey areas combined calculated from the mark-recapture (blue bars) and telemetry correction factor (red bars) approaches during each of the field seasons from 2016-2025.
Haul-out count and photo-ID data collected for the 2025/2026 field season at both the CBBT and Eastern Shore survey areas are currently being analyzed. There is no additional survey work planned.
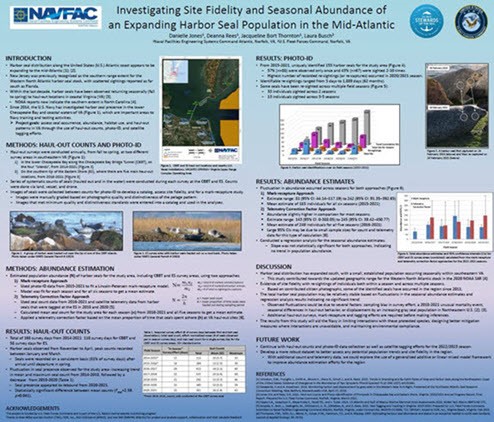
Poster Presentation from 2022 Biennial Conference on the Biology of Marine Mammals.
Project Information
Timeline
2014-2025
Location
Lower Chesapeake Bay and Eastern Shore of Virginia
Visual surveys, photo ID
Principal Investigators
Danielle Jones, NAVFAC Atlantic
Environmental Conservation, Marine Resources Section
Deanna Rees, NAVFAC Atlantic
Environmental Conservation, Marine Resources Section
Sponsor(s) & Funding
Total: $533k, FY26 - $0
